Course system · Mini-project design · Scientific figures

Applied Linear Algebra

Official courseApplied Linear AlgebraPolytechnique Montréal (opens in a new tab)

One course, one visual language and connected mini-projects.

Role
Course-note author; figure and mini-project designer
Period
2024–2026
Status
Teaching system · selected excerpts
Discipline
Applied linear algebra · undergraduate engineering

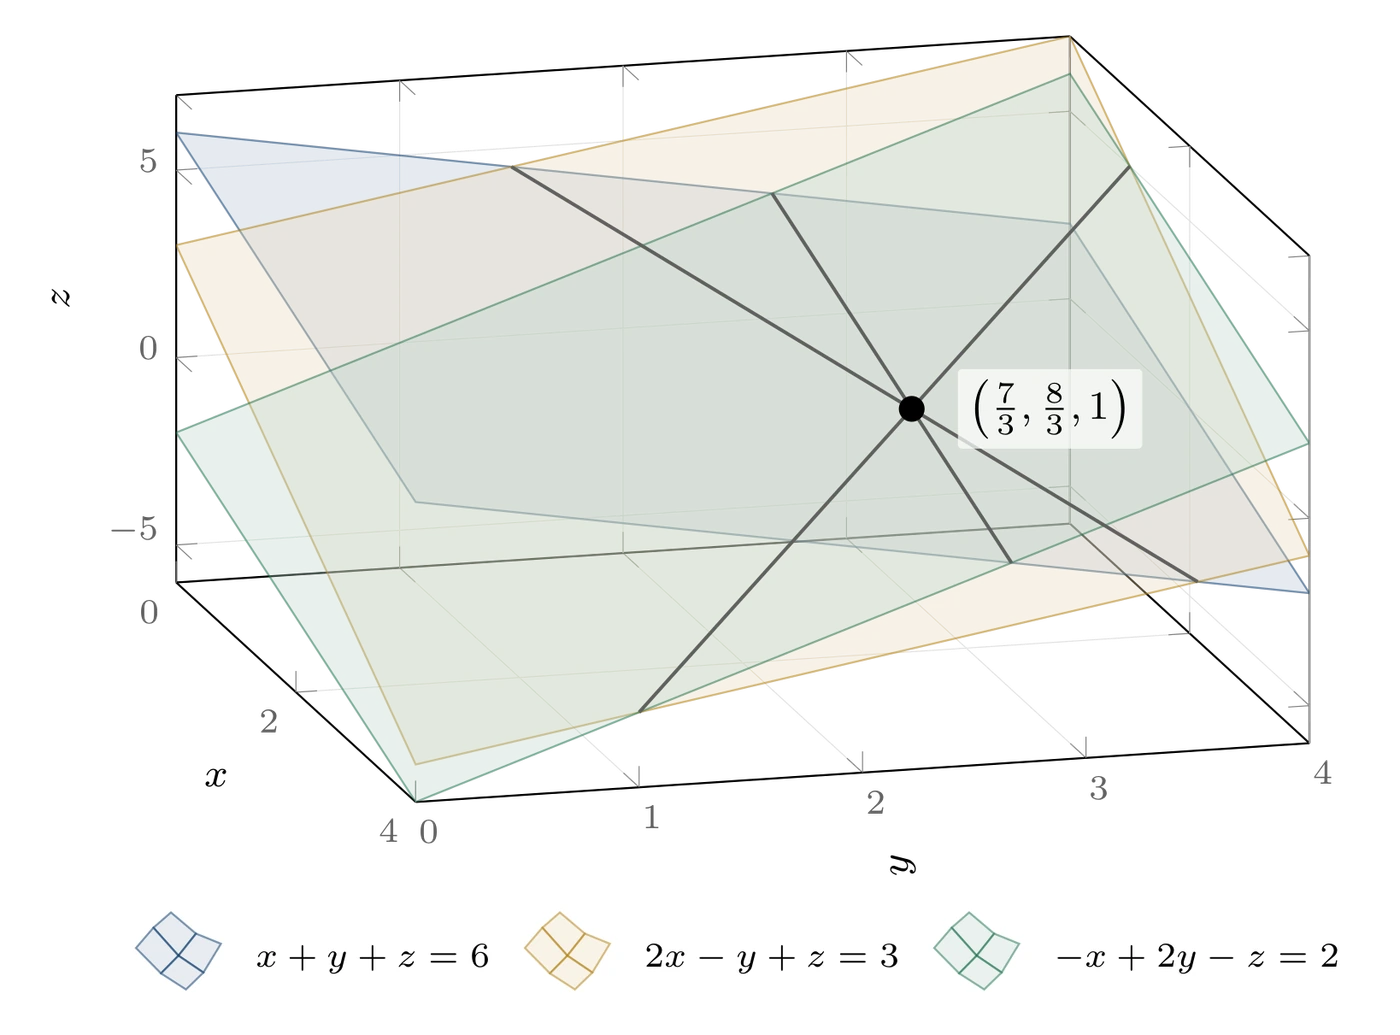
Intersecting planes

Fig. 01

The three pairwise intersection lines converge at one point: the system’s unique solution.

Three planes whose pairwise intersection lines converge at the unique solution (7/3, 8/3, 1).
Project excerptMy standalone TikZ figure · Applied Linear Algebra, course 1
What I produced
  • A structured applied-linear-algebra course
  • Reproducible mathematical diagrams
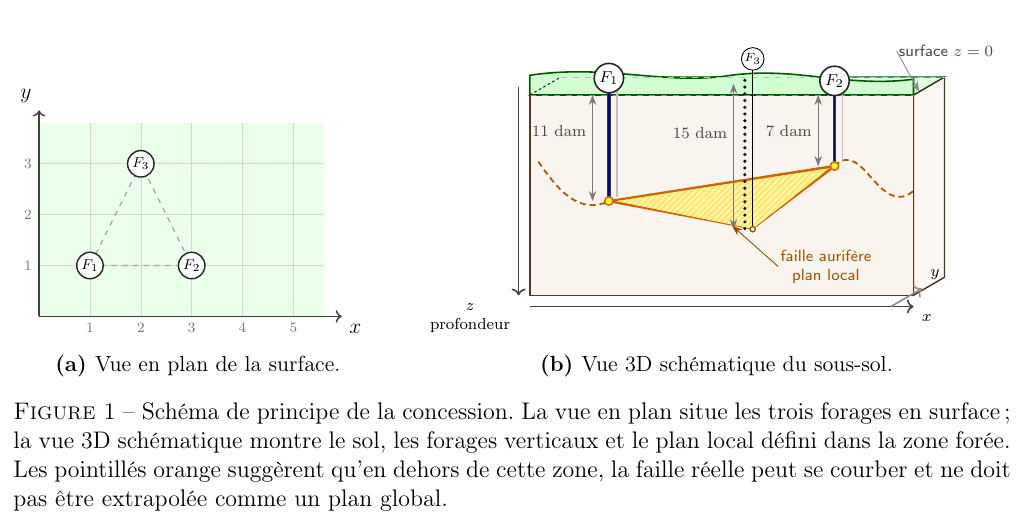
  • Applied mini-projects, including gold-fault modelling
Course production systemLaTeXTikZPythonMoodle

01 · Context + problem

The design challenge

In Applied Linear Algebra, I design a course system that connects notation, reproducible figures and engineering mini-projects.

Students have to move quickly between geometry, symbolic manipulation and physical models. Isolated slides or exercises do not establish those connections by themselves.

02 · Constraints

What the project had to respect.

  • Preserve mathematical precision
  • Connect notation to engineering settings
  • Expose only minimal, non-sensitive excerpts
What was produced
  • A structured applied-linear-algebra course
  • Reproducible mathematical diagrams
  • Applied mini-projects, including gold-fault modelling

03 · How it was built

How I built the content.

  1. 01

    I start each visual from the mathematical relation it must reveal.

  2. 02

    I keep figures reproducible from source rather than editing screenshots.

  3. 03

    I use mini-projects to synthesize several ideas around one engineering model.

05 · Work and scope

What this work shows.

Materials produced

  • Authored course notes
  • Applied mini-projects and scientific figures
  • Figure and Moodle production files

Scope of this presentation

The portfolio presents selected visuals. Course notes and mini-project briefs are not available for download.

The presentation concerns the materials produced, without a study of their effect on learning.

Current public course page (opens in a new tab)

Visible results

  • A consistent visual language across chapters
  • Applied mini-projects connected to the course
  • Content that can be edited from its source files
Limits and status

This selection highlights the course’s visual architecture and applied mini-projects; it is not an exhaustive presentation of the course.

06 · Relevance for your organisation

What this approach makes possible.

For another foundational course, I can design and produce an applied case or a set of figures with your team. Your team leads the pedagogical choices and instructors approve the subject matter. Together we define the formats, files and skills needed to maintain the resource.

Is your team preparing similar content?

Explore the eight-week pilot Ask me a question

07 · Technical approach

Technical approach

Course production systemLaTeXTikZPythonMoodle
01

Production from shared sources

The decks and student handouts are generated from editable course structures instead of maintained as unrelated PDFs.

LaTeX · Beamer · Python

Why it mattersA cross-course correction can be applied at the source and regenerated consistently.

02

Source-generated scientific figures

Geometric constructions and plots are defined as vector sources, with visual and automated checks before they enter the course.

TikZ · PGFPlots

Why it mattersFigures remain precise, revisable and consistent across presentation and print formats.

03

Course delivery as part of the same system

The same session structure is used to generate and validate Moodle-ready course blocks and their resource links.

Python · Moodle

Why it mattersTeaching groups receive a more consistent sequence with fewer publication mismatches.