13 signed decks · Multivariable geometry · 2024

Calculus II

Official courseCalculus IIPolytechnique Montréal (opens in a new tab)

Use consistent visuals to explain space in 2D and 3D.

Role
Author and scientific figure designer
Period
Jan–Apr 2024
Status
Signed courseware series · selected excerpts
Discipline
Multivariable calculus · undergraduate engineering

Parametric curve

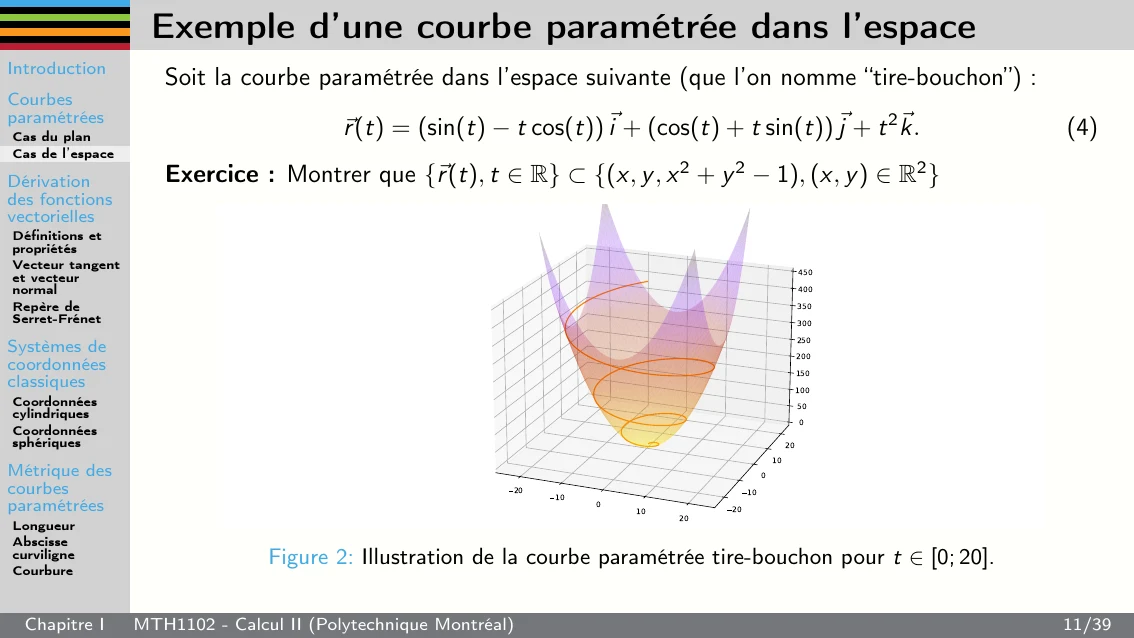
Fig. 01

A parametric curve is located inside the surface it follows.

FR originalCalculus II slide showing an orange helix on a translucent paraboloid.
Project excerptMy Calculus II courseware · 2024
What I produced
  • 13 coherent Calculus II decks
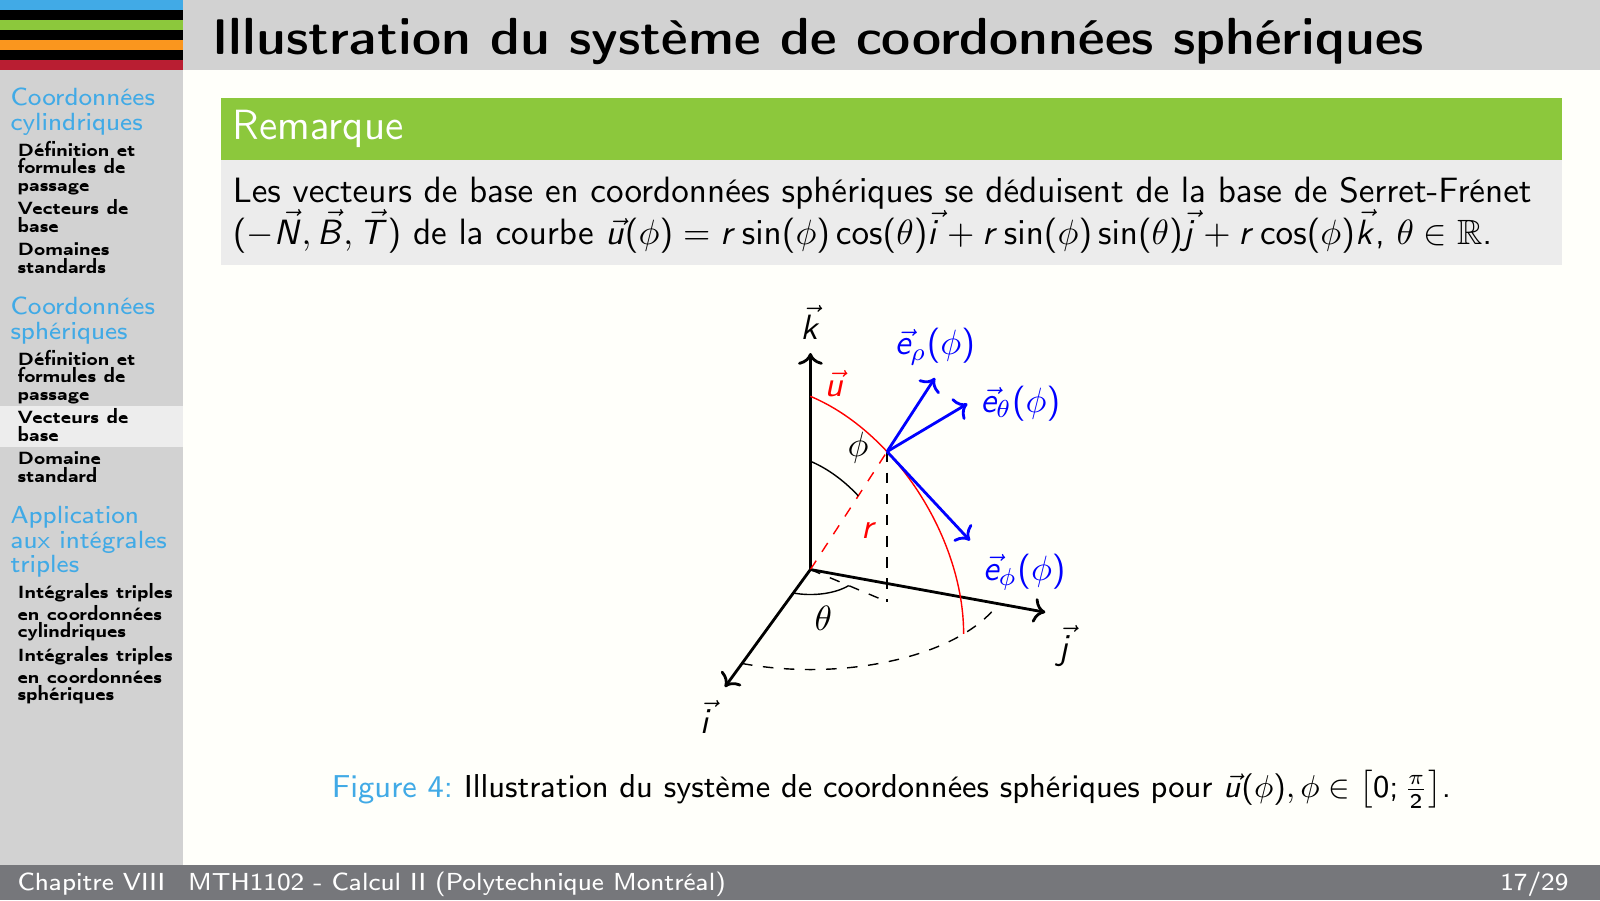
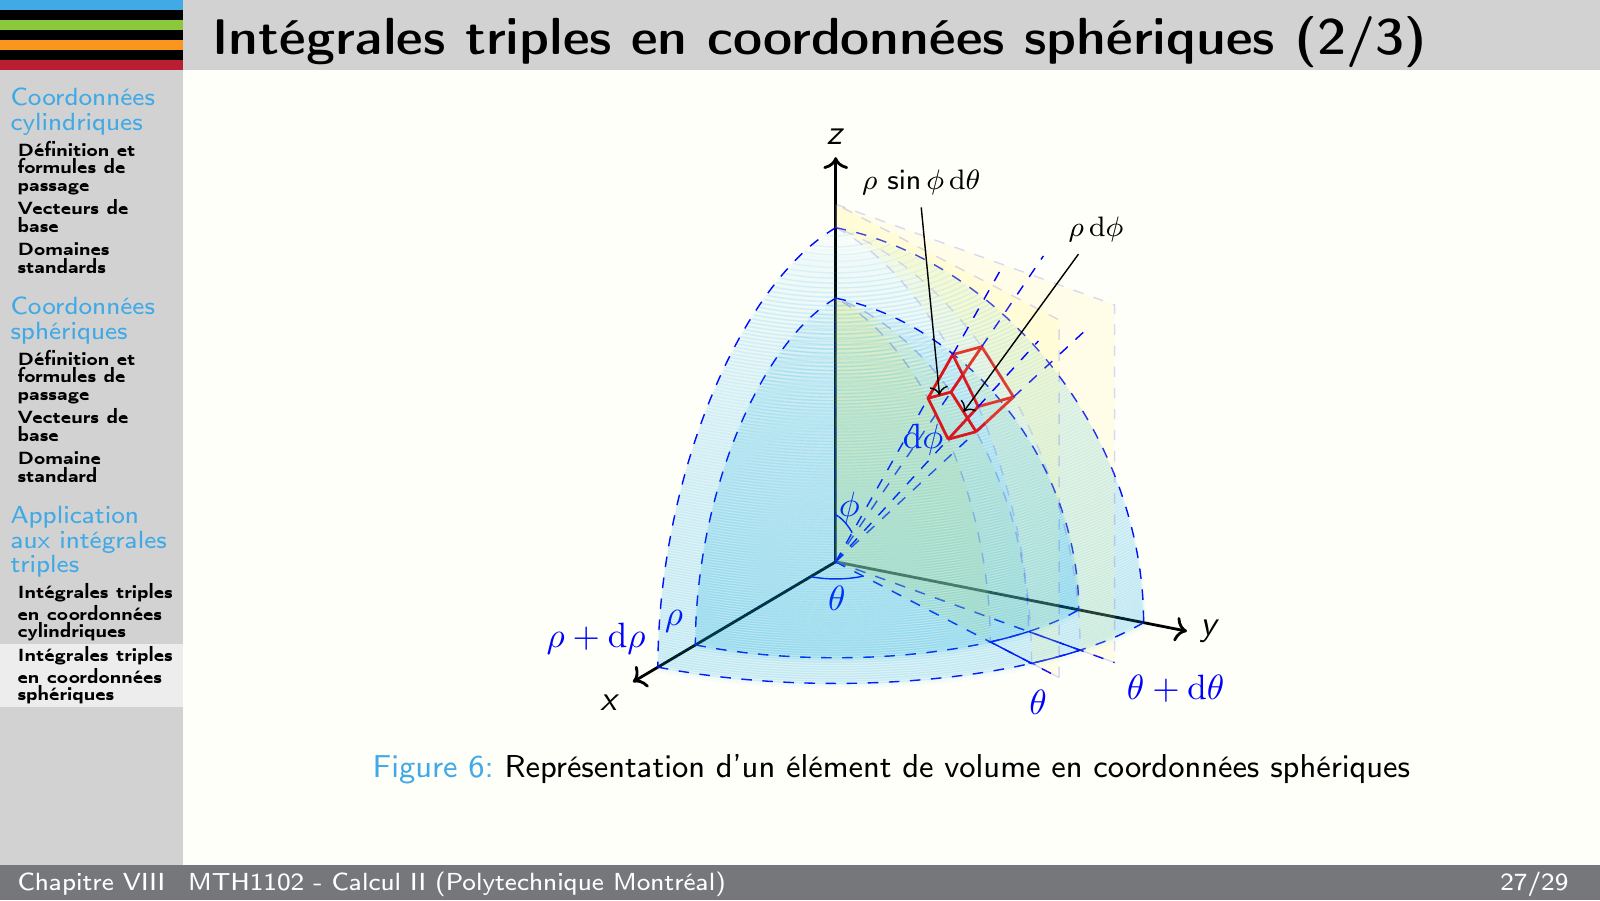
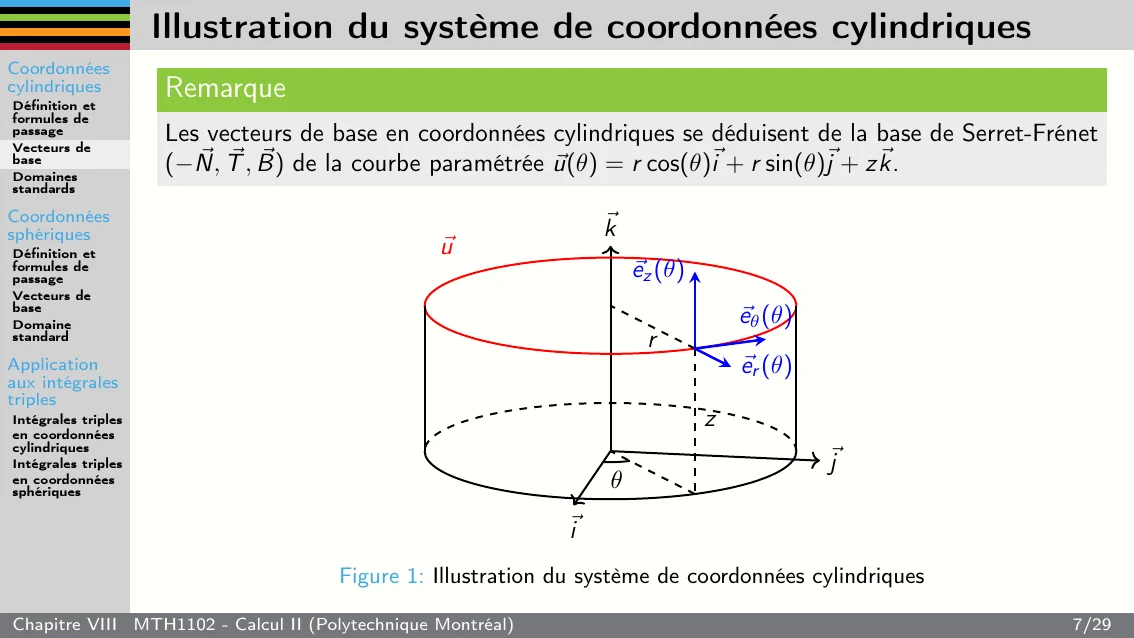
  • Polar, cylindrical and spherical coordinate sequences
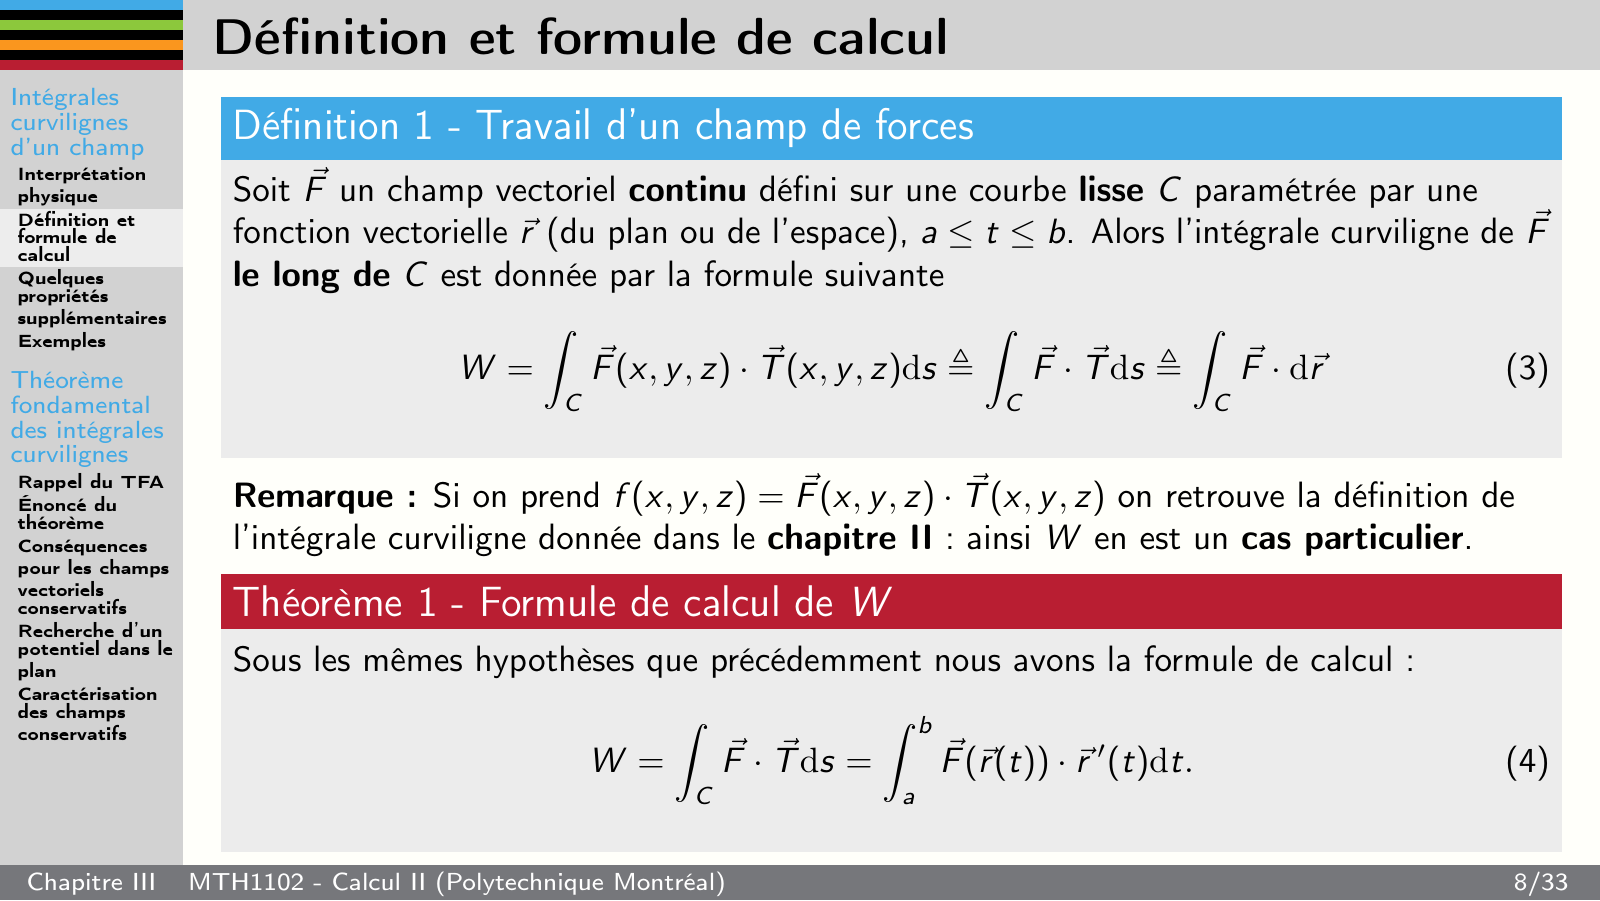
  • Curves, surfaces and differential-volume figures
Scientific production systemLaTeXTikZPGFPlotsPython

01 · Context + problem

The design challenge

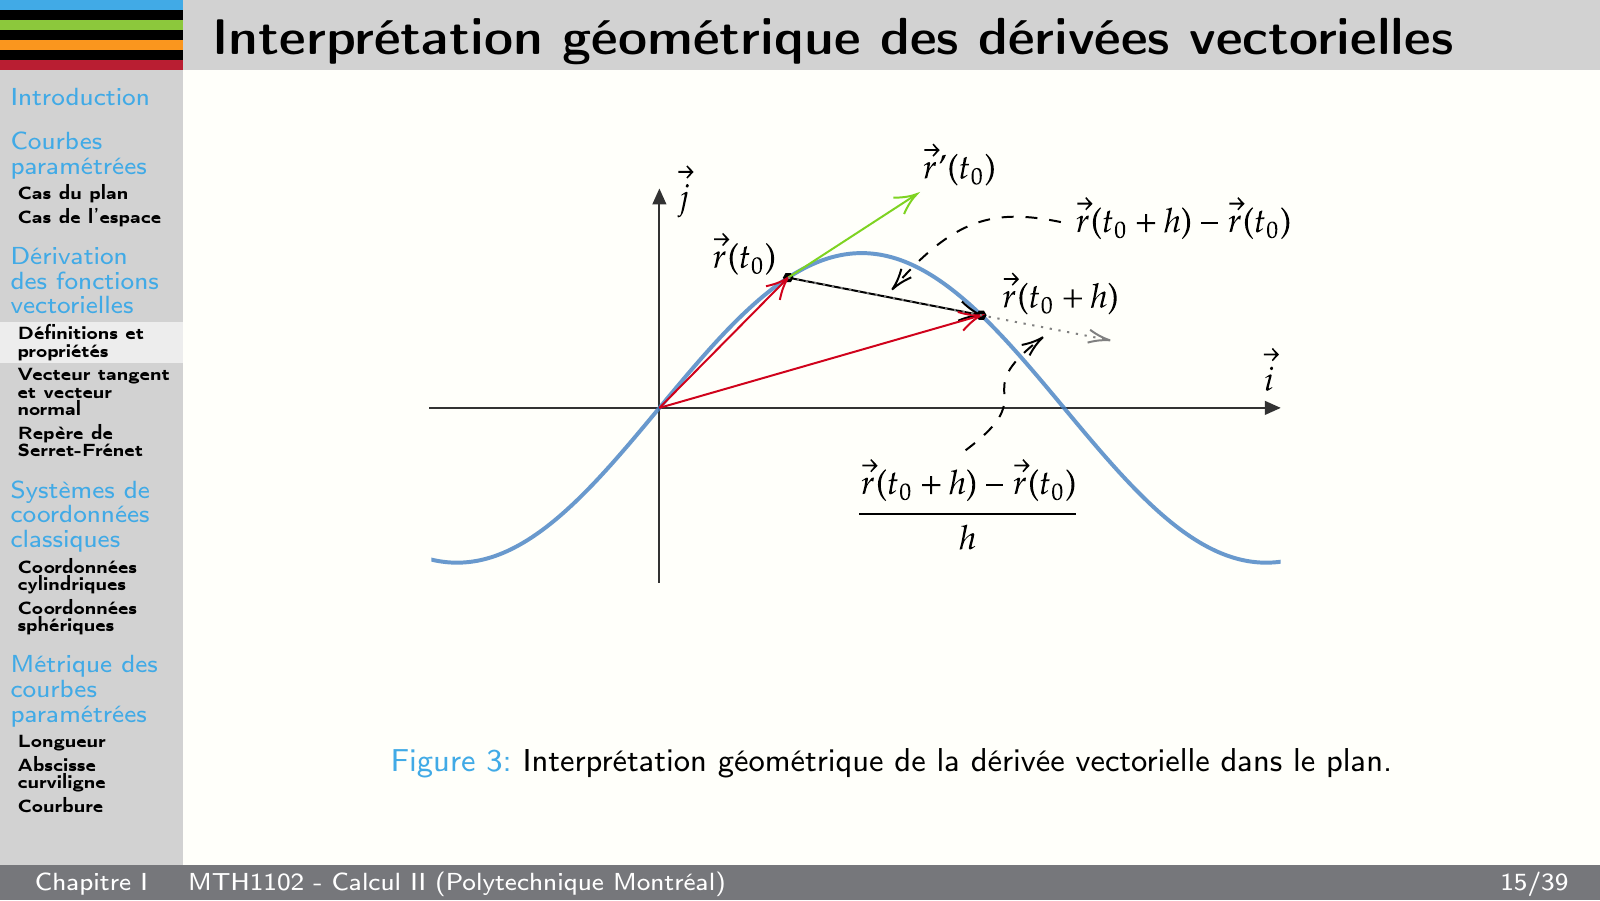
In Calculus II, I help learners reason across two- and three-dimensional representations while notation changes from one coordinate system to another.

A spectacular 3D image can still fail instructionally if the axes, basis vectors and differential elements are not introduced in a stable sequence.

02 · Constraints

What the project had to respect.

  • Make 3D geometry readable in projection
  • Keep notation stable across 13 decks
  • Exclude inherited templates and third-party marks
What was produced
  • 13 coherent Calculus II decks
  • Polar, cylindrical and spherical coordinate sequences
  • Curves, surfaces and differential-volume figures

03 · How it was built

How I built the content.

  1. 01

    I reuse color, notation and page anatomy across the whole series.

  2. 02

    I move from an object, to its coordinate description, to the integral it supports.

  3. 03

    I choose views that preserve orientation and scale cues.

05 · Work and scope

What this work shows.

Materials produced

  • Thirteen authored Beamer decks
  • Figure source files and exported images
  • Selected teaching content in its original language

Scope of this presentation

The excerpts come from the series I authored in 2024. They illustrate its notation and visual composition.

The presentation concerns the materials produced, without a study of their effect on learning.

Visible results

  • A 13-deck system with a recognizable internal logic
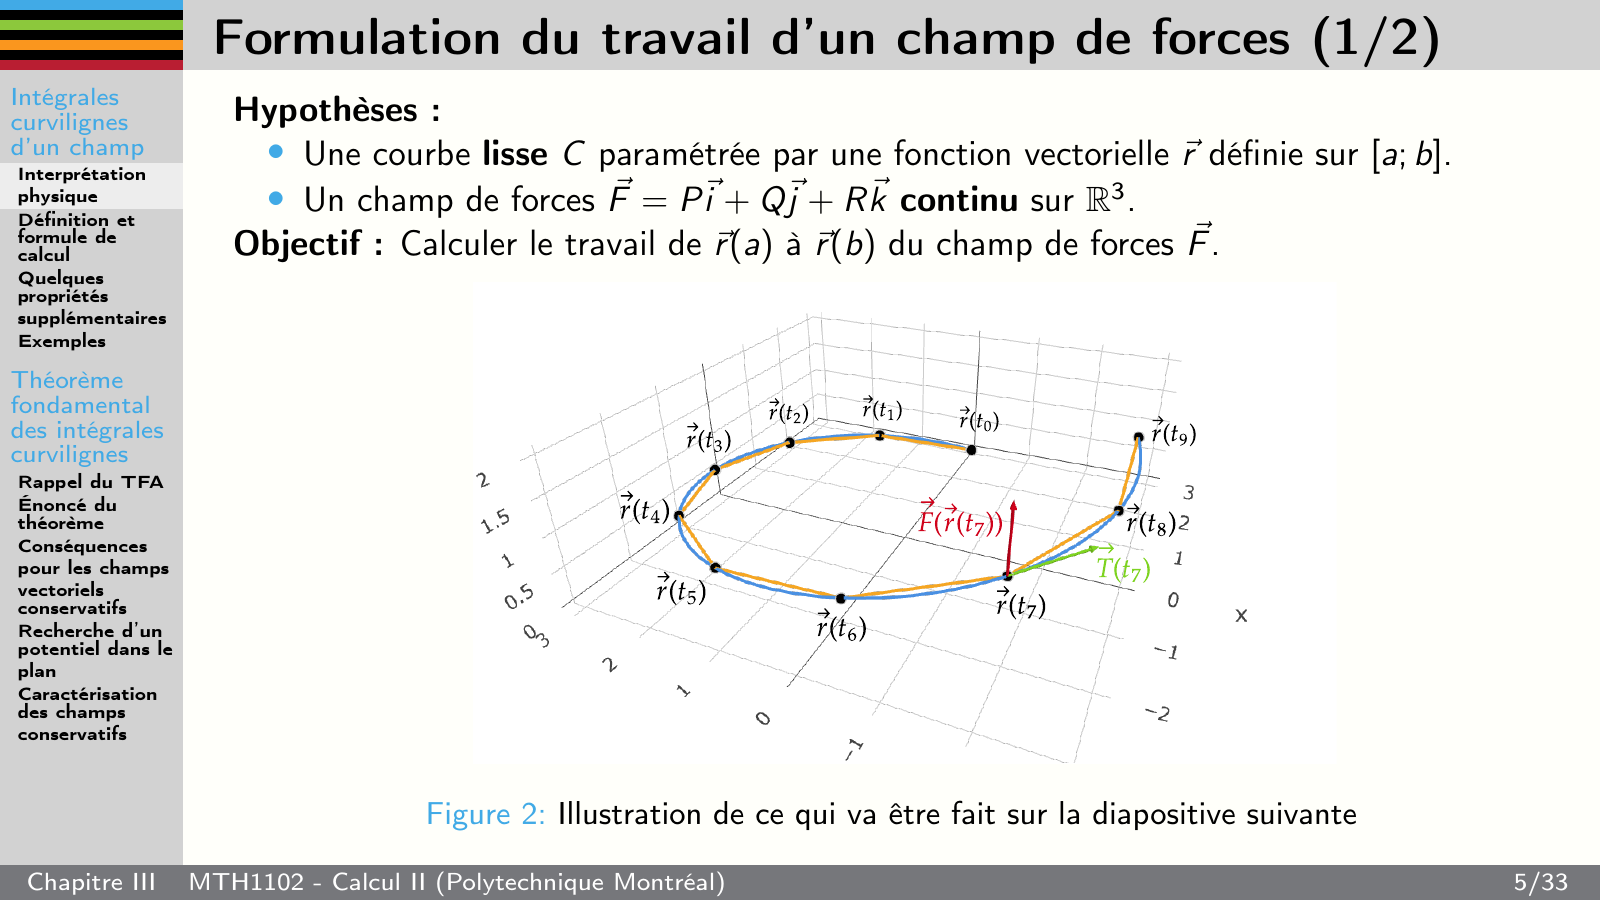
  • A progression from curves to oriented surfaces
  • Reusable geometric figures rather than one-off decoration
Limits and status

These excerpts show the scope and visual authorship of the series; they are not a complete presentation of the course.

06 · Relevance for your organisation

What this approach makes possible.

I can produce a consistent set of figures and slides for a course taught by several instructors. Your team directs the teaching sequence and approves the subject matter; together we choose the templates, formats and documentation needed for future updates.

Is your team preparing similar content?

Explore the eight-week pilot Ask me a question

07 · Technical approach

Technical approach

Scientific production systemLaTeXTikZPGFPlotsPython
01

An editable visual grammar

Axes, basis vectors, surfaces and differential elements are authored from mathematical sources rather than flattened into screenshots.

LaTeX · TikZ · PGFPlots

Why it mattersNotation, views and geometric cues can be revised while preserving consistency across the series.

02

Geometry produced from calculation

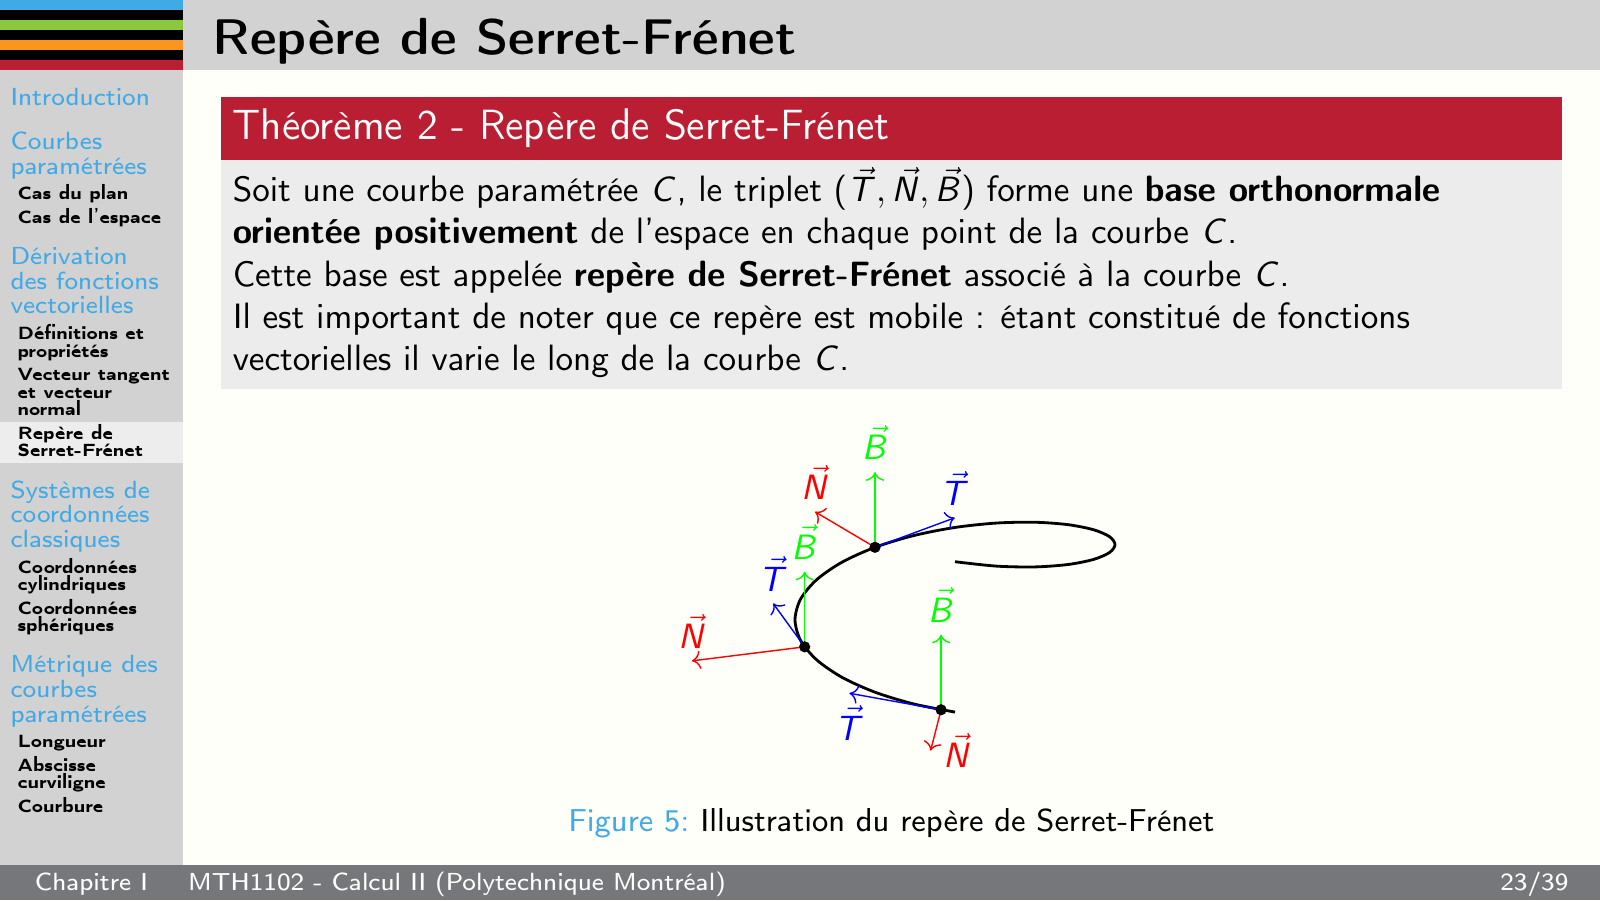
Curves, sliced solids and the Frenet–Serret frame are computed before they are rendered as figures or animations.

Python · NumPy · Matplotlib · SymPy

Why it mattersThe visual explanation stays tied to the mathematical object instead of a manually drawn approximation.

03

Output matched to the concept

Vector figures support close reading, while animation is used when orientation or motion must unfold over time.

SVG · Matplotlib

Why it mattersEach idea is presented in a medium that preserves the cues learners need.